pyami
An Overview of #semanticClimate Toolkit
The Toolkit consists of several components which work together as a toolchain. There can be more than one toolchain. The pyami tool takes a PDF and converts it into HTML pages. These HTML pages are processed to get structured or semantic HTML. We also add meaning to a lot of the components of the HTML. We can reorganize, search, or annotate the structured HTML.
Converting Raw PDF to Semantic HTML
Watch this 15 min. to get a glimpse of IPCC report PDF and semantic HTML version.
In essence, we go from:
to:
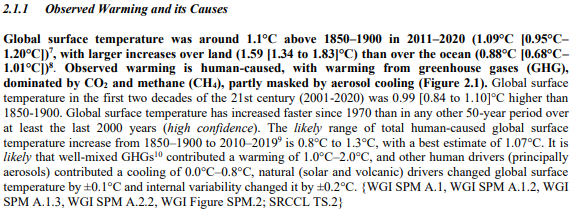
<div left="56.04" right="253.49" top="557.13"><span style="x0: 56.04; x1: 61.56; y0: 557.13; y1: 568.17; width: 5.52; font-size: 11.04; font-family: TimesNewRomanPS-BoldItalicMT;" x0="56.04" y0="557.13" x1="253.49" id="subsection_2.1.1" title="Observed Warming and its Causes " class="sub_sub_section_title">2.1.1 Observed Warming and its Causes </span></div>
<div left="56.64" right="538.44" top="531.93"><span style="x0: 56.64; x1: 65.23; y0: 531.93; y1: 542.97; width: 8.59; font-size: 11.04; font-family: TimesNewRomanPS-BoldMT;" x0="56.64" y0="531.93" x1="538.44">Global surface temperature was around 1.1°C above 1850–1900 in 2011–2020 (1.09°C [0.95°C– 1.20°C])</span><span style="x0: 95.54; x1: 99.02; y0: 524.05; y1: 531.01; width: 3.48; font-size: 6.96; font-family: TimesNewRomanPS-BoldMT;" x0="95.54" y0="524.05" x1="99.02">7</span><span style="x0: 99.02; x1: 101.78; y0: 519.21; y1: 530.25; width: 2.76; font-size: 11.04; font-family: TimesNewRomanPS-BoldMT;" x0="99.02" y0="519.21" x1="538.56">, with larger increases over land (1.59 [1.34 to 1.83]°C) than over the ocean (0.88°C [0.68°C– 1.01°C])</span><span style="x0: 95.54; x1: 99.02; y0: 511.45; y1: 518.41; width: 3.48; font-size: 6.96; font-family: TimesNewRomanPS-BoldMT;" x0="95.54" y0="511.45" x1="99.02">8</span><span x0="99.02" y0="506.61" x1="104.54" style="x0: 99.02; x1: 101.78; y0: 506.61; y1: 517.65; width: 2.76; font-size: 11.04; font-family: TimesNewRomanPSMT;">. </span><span style="x0: 108.86; x1: 117.45; y0: 506.61; y1: 517.65; width: 8.59; font-size: 11.04; font-family: TimesNewRomanPS-BoldMT;" x0="108.86" y0="506.61" x1="541.02">Observed warming is human-caused, with warming from greenhouse gases (GHG), dominated by CO</span><span style="x0: 142.34; x1: 145.82; y0: 493.81; y1: 500.77; width: 3.48; font-size: 6.96; font-family: TimesNewRomanPS-BoldMT;" x0="142.34" y0="493.81" x1="148.58">2 </span><span style="x0: 149.54; x1: 155.06; y0: 493.89; y1: 504.93; width: 5.52; font-size: 11.04; font-family: TimesNewRomanPS-BoldMT;" x0="149.54" y0="493.89" x1="234.99">and methane (CH</span><span style="x0: 235.13; x1: 238.61; y0: 493.81; y1: 500.77; width: 3.48; font-size: 6.96; font-family: TimesNewRomanPS-BoldMT;" x0="235.13" y0="493.81" x1="238.61">4</span><span style="x0: 238.49; x1: 242.17; y0: 493.89; y1: 504.93; width: 3.68; font-size: 11.04; font-family: TimesNewRomanPS-BoldMT;" x0="238.49" y0="493.89" x1="472.06">), partly masked by aerosol cooling (Figure 2.1). </span><span x0="473.02" y0="493.89" x1="541.02" style="x0: 473.02; x1: 480.99; y0: 493.89; y1: 504.93; width: 7.97; font-size: 11.04; font-family: TimesNewRomanPSMT;" class="statement">Global surface temperature in the first two decades of the 21st century (2001-2020) was 0.99 [0.84 to 1.10]°C higher than 1850-1900. Global surface temperature has increased faster since 1970 than in any other 50-year period over at least the last 2000 years (</span><span style="x0: 196.61; x1: 202.13; y0: 455.97; y1: 467.01; width: 5.52; font-size: 11.04; font-family: TimesNewRomanPS-ItalicMT;" x0="196.61" y0="455.97" x1="269.52" title="high confidence" class="confidence">high confidence</span><span x0="269.45" y0="455.97" x1="301.36" style="x0: 269.45; x1: 273.13; y0: 455.97; y1: 467.01; width: 3.68; font-size: 11.04; font-family: TimesNewRomanPSMT;">). The </span><span style="x0: 304.39; x1: 307.46; y0: 455.97; y1: 467.01; width: 3.07; font-size: 11.04; font-family: TimesNewRomanPS-ItalicMT;" x0="304.39" y0="455.97" x1="330.91" title="likely" class="probability">likely </span><span x0="333.91" y0="455.97" x1="540.98" style="x0: 333.91; x1: 337.59; y0: 455.97; y1: 467.01; width: 3.68; font-size: 11.04; font-family: TimesNewRomanPSMT;">range of total human-caused global surface temperature increase from 1850–1900 to 2010–2019</span><span x0="290.45" y0="448.21" x1="293.93" style="x0: 290.45; x1: 293.93; y0: 448.21; y1: 455.17; width: 3.48; font-size: 6.96; font-family: TimesNewRomanPSMT;">9</span><span x0="297.19" y0="443.37" x1="540.86" style="x0: 297.19; x1: 300.26; y0: 443.37; y1: 454.41; width: 3.07; font-size: 11.04; font-family: TimesNewRomanPSMT;">is 0.8°C to 1.3°C, with a best estimate of 1.07°C. It is </span><span style="x0: 56.64; x1: 59.71; y0: 430.65; y1: 441.69; width: 3.07; font-size: 11.04; font-family: TimesNewRomanPS-ItalicMT;" x0="56.64" y0="430.65" x1="83.3" title="likely" class="probability">likely </span><span x0="83.9" y0="430.65" x1="185.14" style="x0: 83.9; x1: 86.97; y0: 430.65; y1: 441.69; width: 3.07; font-size: 11.04; font-family: TimesNewRomanPSMT;">that well-mixed GHGs</span><span x0="185.21" y0="435.49" x1="192.17" style="x0: 185.21; x1: 188.69; y0: 435.49; y1: 442.45; width: 3.48; font-size: 6.96; font-family: TimesNewRomanPSMT;" title="superscript_10">10</span><span x0="195.53" y0="430.65" x1="540.9" style="x0: 195.53; x1: 200.43; y0: 430.65; y1: 441.69; width: 4.9; font-size: 11.04; font-family: TimesNewRomanPSMT;" title="WGI SPM A.1, WGI SPM A.1.2, WGI SPM A.1.3, WGI SPM A.2.2, WGI Figure SPM.2; SRCCL TS.2" class="targets">contributed a warming of 1.0°C–2.0°C, and other human drivers (principally aerosols) contributed a cooling of 0.0°C–0.8°C, natural (solar and volcanic) drivers changed global surface temperature by ±0.1°C and internal variability changed it by ±0.2°C. {WGI SPM A.1, WGI SPM A.1.2, WGI SPM A.1.3, WGI SPM A.2.2, WGI Figure SPM.2; SRCCL TS.2} </span></div>
which looks like this when rendered

You can check out the full HTML, here
In the next blog, we will look at how we extract information from the semantic HTML using our tools (docanalysis, keyphrase_extractor, summarizer)
← Back